Every plant we talk to has data. A historian with years of trends, an ERP, shift logs on paper or in a spreadsheet. Every plant also has people who improve things: the shift lead who knows the trick for a rough start-up, the CI lead with a board full of actions.
What differs is whether the two meet.
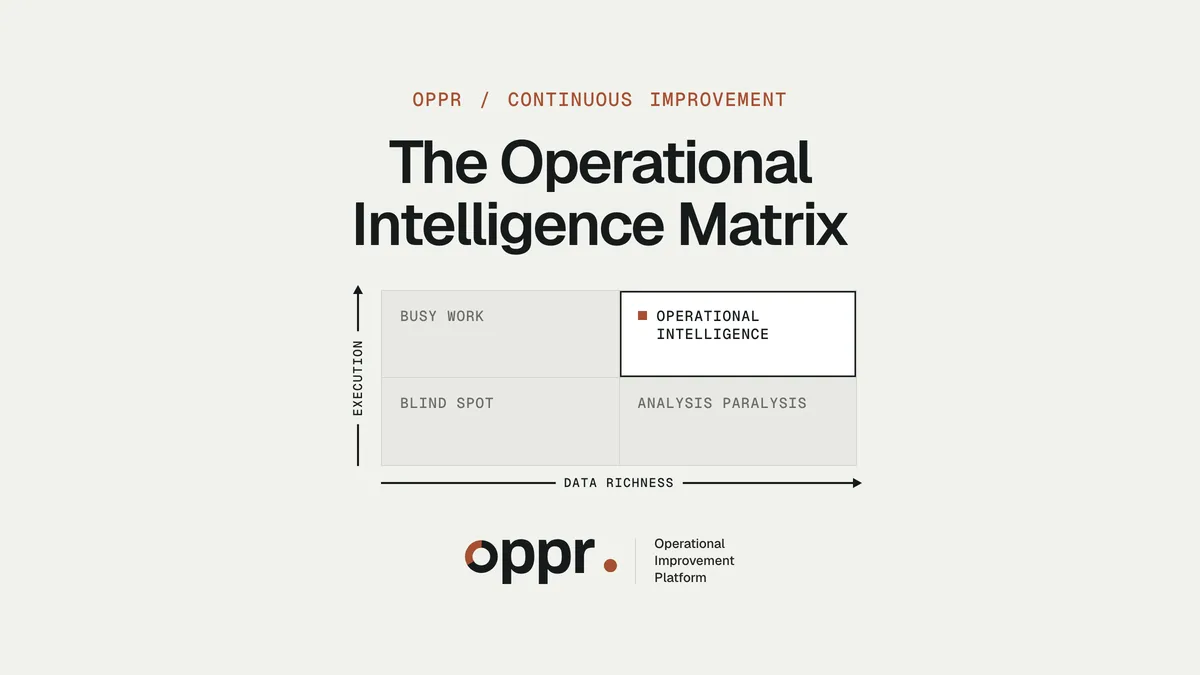
The Operational Intelligence Matrix is a simple way to see that. It puts a plant on two axes, and gives four places it can stand.
The two axes
Data richness, across. How much the plant knows about its own process, and how much of that is on record. Not only what the machines log, but what the shift sees: the sound before a blockage, the reading nobody trusts, the reason a batch was held back. A historian full of trends without that context is not rich data. It is a lot of data.
Execution, up. How reliably the plant acts on what it knows. A finding becomes a change, the change is tested on the floor, and what holds is still being done months later, on every shift.
Execution
- Busy WorkEffort without records. The gains fade.
- Operational IntelligenceKnowledge on record, acted on, held.
- Blind SpotKnowledge in people’s heads. Problems repeat.
- Analysis ParalysisData without action. Nothing changes.
Data richness
Where a plant sits says nothing about how good its people are. It says how much of what they know reaches the record, and how much of what the record shows reaches the floor.
Blind Spot
In the bottom left, the knowledge lives in people’s heads. The plant runs on a few experienced operators. They know which alarm can wait, which reading to doubt, what a pump sounds like before it fails. On their shifts things go smoothly. On other shifts the same problem takes twice as long. When they retire, what they knew retires with them.
Problems repeat, and every shift starts from zero. The stop goes into the log as “Other”. Nobody links this week’s blockage to the one last month, because nothing links them.
You don’t know what you don’t know. That is the blind spot.
Busy Work
In the top left, the plant works hard at improvement. Kaizen weeks, 5S audits, an action list on every board, a CI lead with a full calendar. The energy is real.
But the choices rest on gut feel, and on whoever speaks first in the morning meeting. Nobody can show which change made the difference, so nobody can show why it should stay. Each improvement lives in its own spreadsheet. When the one person who combines them is off, nothing is combined.
So the gains fade. The checklist from the kaizen week has nobody asking about it. It slides to the bottom of the list, then off it. We wrote about that pattern in Why improvements fade after six weeks.
Busy Work feels like progress. A few months later, the number is back where it was.
Analysis Paralysis
The bottom right is the opposite corner. Sensors on every line, a historian going back ten years, dashboards on a screen in the control room. Often a data project, sometimes an AI pilot.
The data stays in reports. The morning meeting looks at last night’s trend, agrees it looks odd, and moves on. The insight never becomes a change on the floor, so the floor does not change.
What is missing is rarely more data. It is the context only the shift has. The trend shows the pressure over a filter rising at 02:40. It does not show that the feed changed just before, or that the shift lead flushed longer and ran the pump at half to keep the line going. That part is in nobody’s system.
Pointing AI at this data does not get a plant out of the corner. It finds patterns nobody acts on, only faster. We wrote about why in AI in continuous improvement: why the records come before the algorithm.
Operational Intelligence
In the top right, what the shift sees and what the machines record end up on one timeline. When a problem comes back, there is a record of what happened the last time, and of what was tried.
A recurring problem gets a hypothesis. The plant’s own people test it on the floor. What holds goes into standard work, and every shift confirms it is still being done. The next improvement starts from where the last one held.
Operational intelligence is not a product or a dashboard. It is a plant that learns from its own process and keeps what it learns.
It does not mean every problem is solved. It means a problem gets solved once, instead of every few weeks.
How a plant moves to the top right
Not in one jump. A large IT project tries to jump to the right, and lands in Analysis Paralysis. A large improvement programme tries to jump up, and lands in Busy Work. Both try to fix one axis without the other.
What works is smaller. One problem that keeps coming back, on one line, taken through four steps. Two steps move the plant to the right. Two move it up.
- Capture. More data, where the problem needs it. The shift notes what it sees at the machine, on the phone it already carries: a photo, a few words, a voice note.
- Connect. More data, with its context. The note lands next to the machine data on one timeline. The analysis looks across both and proposes hypotheses. A correlation, not a cause.
- Execute. More execution. The plant’s own people test each hypothesis on the floor and make the call. What holds goes into standard work. A disproved hypothesis is a valid outcome too.
- Verify. Execution that holds. Every shift confirms the change with a photo, a reading or a sign-off, so the gain stays in place.
Capture, Connect: data richnessExecute, Verify: executionOne big jump
Each cycle leaves a measured improvement and a plant that is a little more digital, only where it needed to be. Repeat it, and the plant moves up and to the right, one held improvement at a time.
There is a limit. This works best on a recurring problem someone on site can already name. It is not a way to digitize a plant from scratch.
Where does your plant stand?
Three questions place a plant quickly.
- 01When a problem comes back, can you find what the shift saw the last time?
- 02Which improvement from last year is still being done on every shift, and how would you know?
- 03When the morning meeting spots something in the data, does anything change on the floor that day?
A no to the first is low data, whatever the historian holds. A no to the second is low execution, however busy the board looks. A no to the third means the two have not met yet.
Which quadrant is your plant in, and which problem would move it first?